
Quick facts
- Platform
- Dataverse / Dynamics 365
- Usage
- XrmToolBox tool (Windows)
- Installation
- Manual - one DLL
- Requirements
- XrmToolBox 1.2025.10.74+
- Cost
- Free
- Licence
- MIT
- Version
- 1.11.5
- Source
- GitHub
Overview
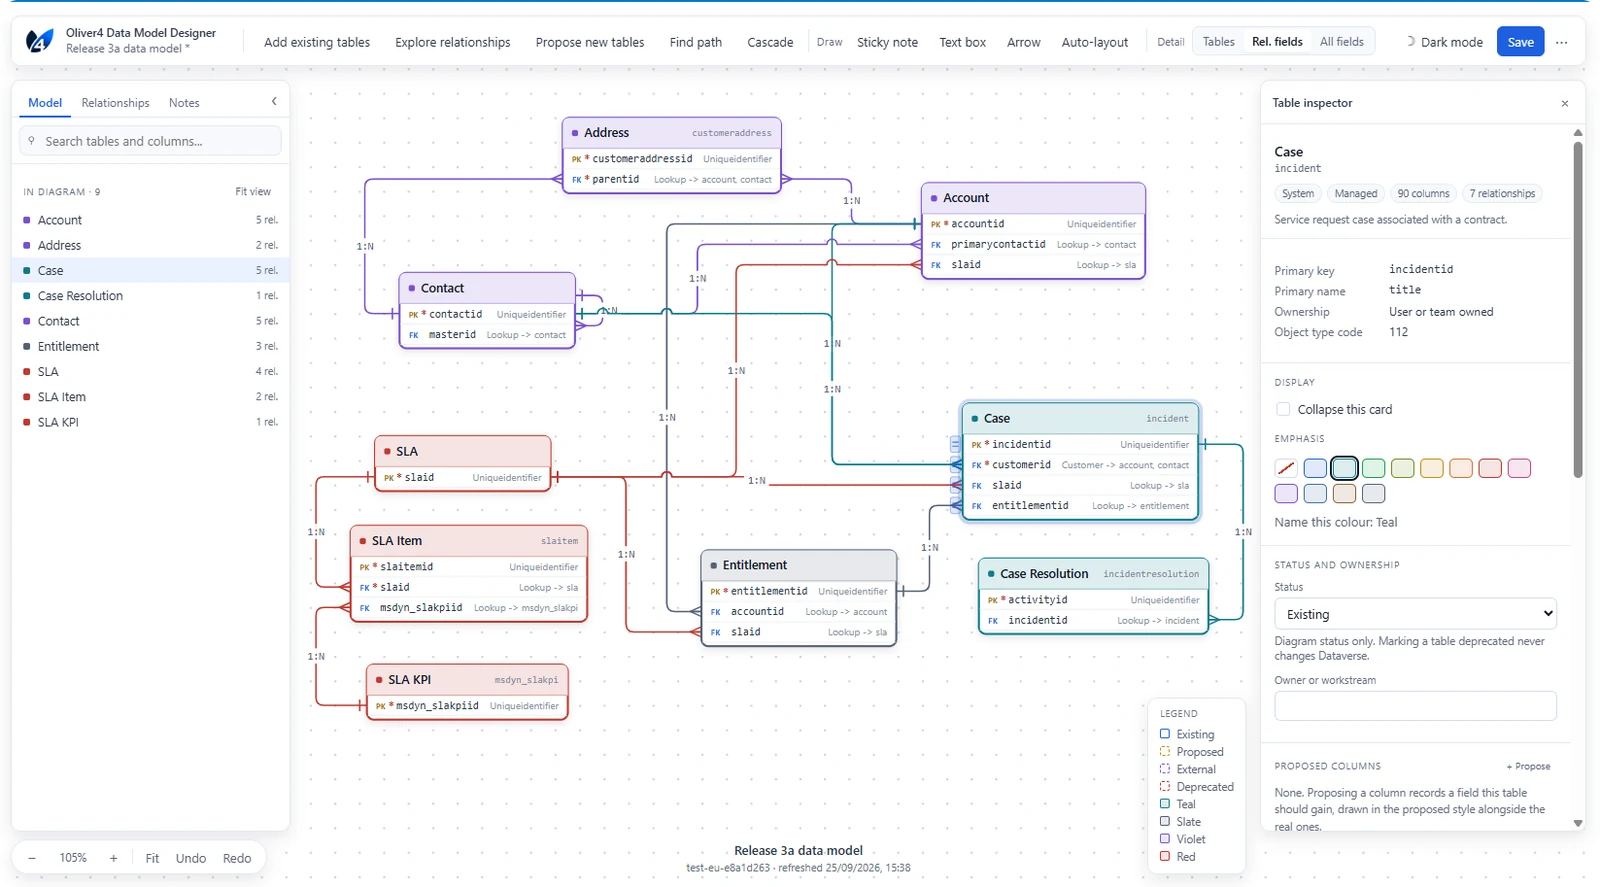
Oliver4 Data Model Designer builds an entity relationship diagram from the metadata in a connected environment, then lets you work on it. You can start from a solution, from tables you pick yourself, or from a blank canvas, and work outwards from one table to see what it is related to.
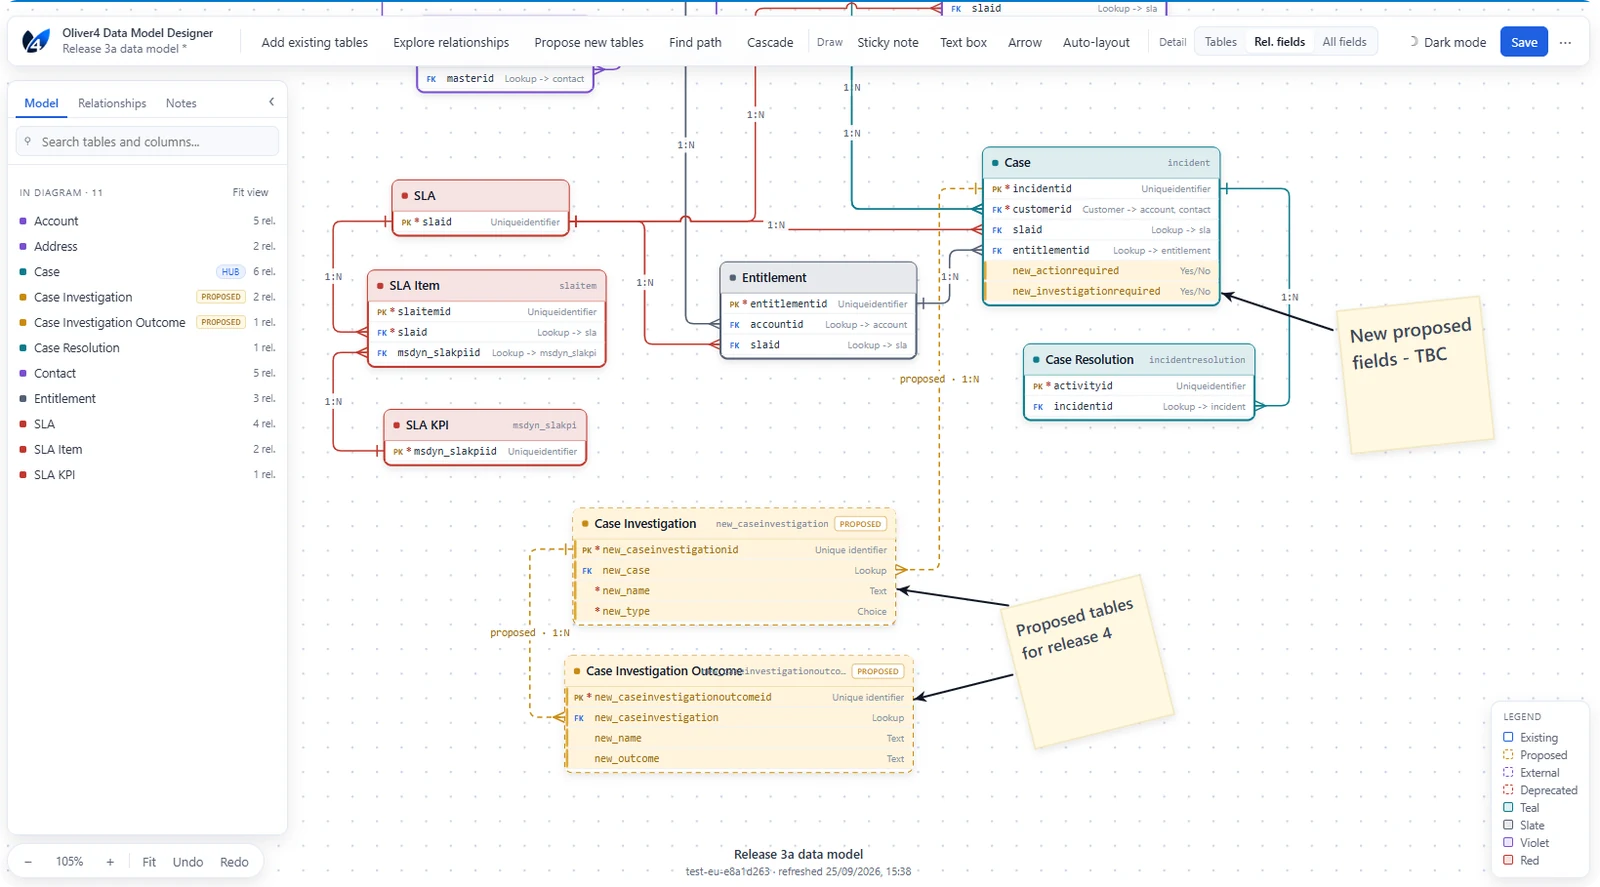
It is more than an ERD exporter. Alongside the tables that exist you can add proposed tables, columns and relationships, mark existing objects as deprecated, and show external systems, all visibly distinguished on the canvas. Diagrams are saved as a .dvmd file, reopened later and refreshed against Dataverse with a review of what has been found, changed or removed.
The tool only ever reads metadata. Nothing it does changes the connected environment. Removing a table from a diagram, marking something deprecated or designing a proposed table are all diagram-level actions held in the file.
Who is it for?
- Solution architects designing a Dataverse data model and needing to show current and future state on the same diagram
- Dynamics 365 and Power Platform developers who need to understand an unfamiliar model before changing it
- Technical consultants producing data model documentation for a design document
- Anyone who needs to know what a delete or a reassign action will impact before running it
- Teams who want a data model diagram that lives in source control next to its solution
Screenshots
Why build another ERD tool?
XrmToolBox already has diagram tools. This one was built to go further in three ways.
-
Diagrams that look designed
A Visio-style canvas. Drag cards, route connectors, add notes, arrows and named colours, then save or export the diagram.
Usually: a fixed, generated picture
Here: a canvas you arrange and annotate
-
You choose the detail
Tables only, relationship columns or every column - for the whole diagram or table by table. Five default layouts you can customise, plus toggles for names, types and keys.
Usually: one level of detail for everything
Here: set per diagram or per table
-
Design what comes next
Add proposed tables, columns and relationships to the diagram generated from your solution, plus external systems and deprecated objects, each clearly marked.
Usually: current state only
Here: current and proposed side by side
Features
-
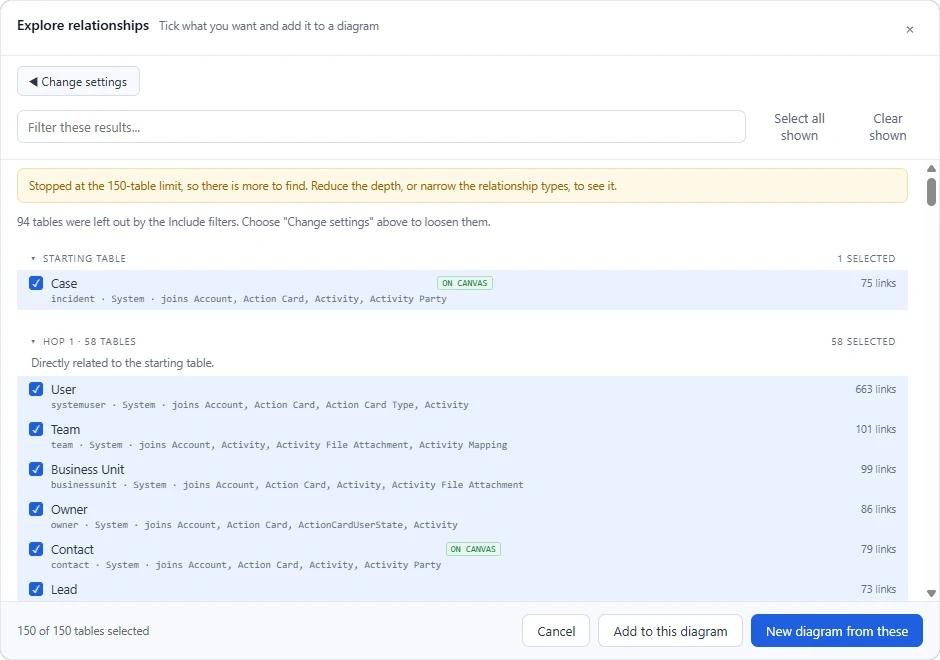
Explore relationships from one table
Start at a single table and work outwards to a chosen depth, with the relationships grouped by hop. Filters include relationship direction, many-to-many, Microsoft-supplied tables, activity tables and platform components. Nothing is added to the diagram until you have reviewed the results.
-
Relationship detail without leaving the canvas
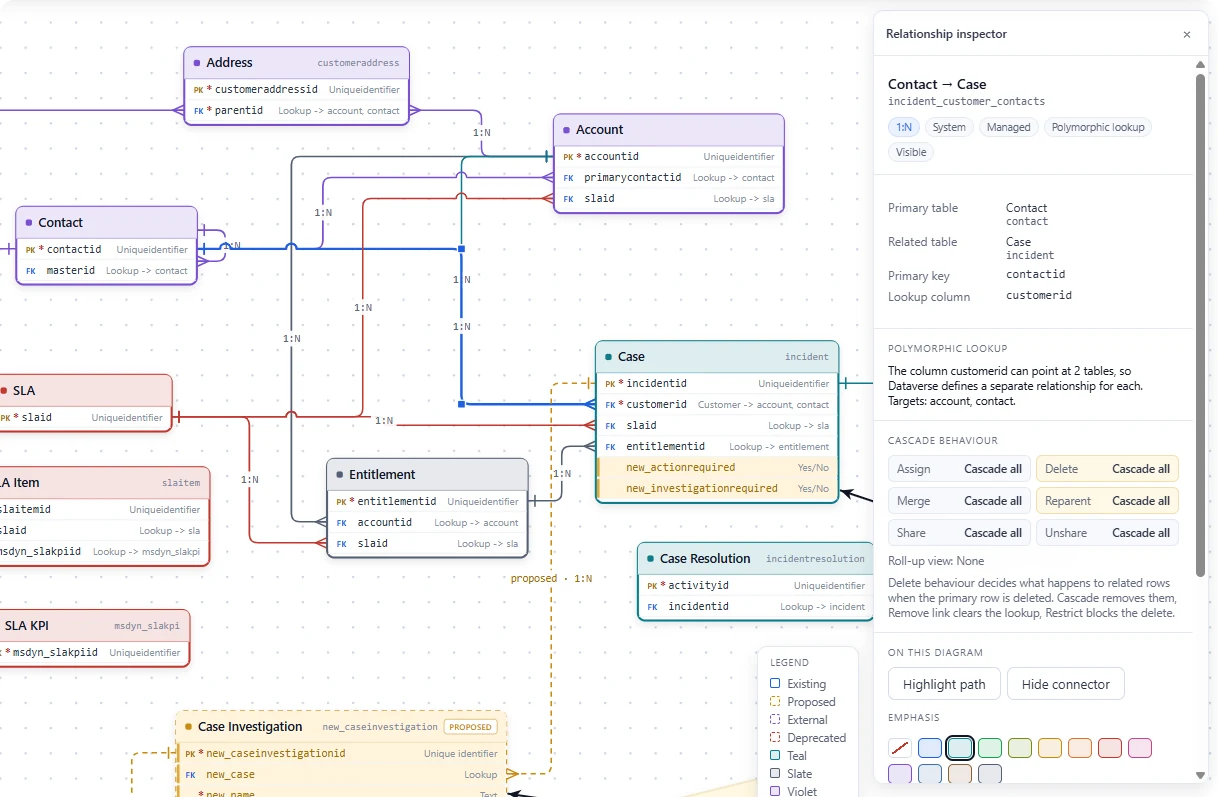
The inspector panel shows a relationship's schema name, cardinality, primary key, lookup column, targets and the complete assign, delete, merge, reparent, share and unshare cascade configuration.
-
Design the future state on the current model
One Propose button covers a new table, a column on an existing table, a relationship between any two tables, and an external system. A proposed relationship automatically creates the lookup column on the table and draws the connector to that row, so the design reads the way the solution will be built.
-
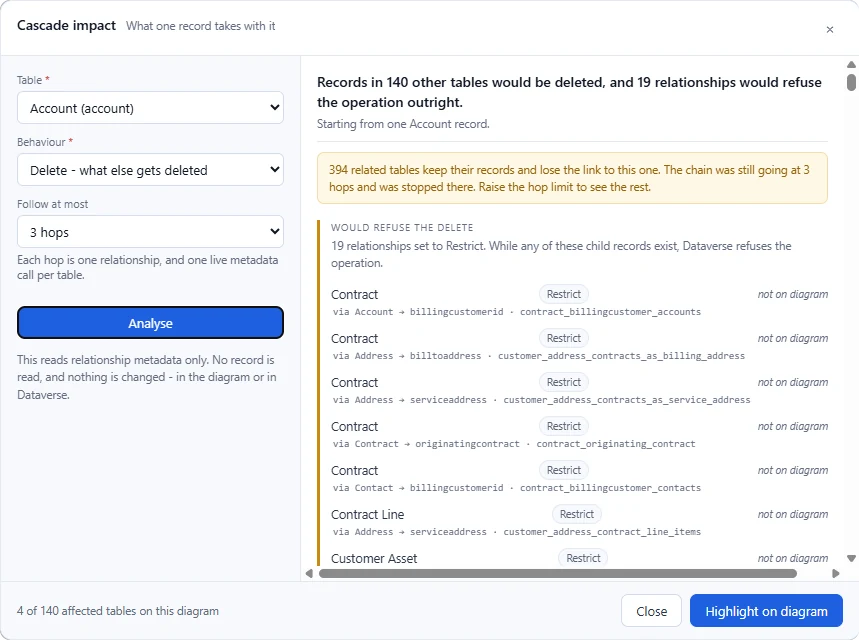
Cascade impact analysis
Pick a table and follow the chain to see what deleting or reassigning one record impacts, what would refuse the action outright, and what keeps its records but removes the link. The analysis uses live metadata rather than the diagram, so it includes tables you did not think to add.
-
Save, reopen and refresh
Diagrams are saved as
.dvmdfiles. Reopening and refreshing against Dataverse produces a review of what has been found, changed or removed, including columns added since the last refresh. Nothing proposed is promoted to your existing diagram without your confirmation. -
Diagram and documentation exports
Export to PNG, SVG, draw.io, Mermaid, or Visio. Documentation exports produce the data model section of a design document as Markdown or a self-contained HTML page, covering the table catalogue, the relationships with their cascade behaviour, and a register of everything the diagram proposes.
The full feature list
Starting a diagram
- New diagram from a solution
- New diagram from manually selected tables
- Start from a blank canvas
- Open a saved
.dvmddiagram - Guided wizard, one question per step
- Tables pre-ticked for solutions under 200 tables
- Confirmation prompt above 20 selected tables
Tables and relationships
- Discovers 1:N, N:1 and N:N relationships
- Filters by type, table, custom and text
- Environment-wide search across tables and columns
- Add a table found elsewhere, with its relationships
- Hub and orphan table indicators
- Relationship path finder between two tables
- Alternate keys marked on the card
Detail and display
- Tables-only, relationship-columns and all-columns modes
- Per-table detail overrides
- Toggles for display names, schema names and types
- Primary key and alternate key markers
- Red asterisk on mandatory columns
- Cardinality and cascade labels on connectors
- Record ownership marker on each card
- Column order setting, matched in exports
Canvas
- Pan by drag or right-click drag
- Zoom in and out or to a preset
- Marquee select, snap to grid, undo and redo
- Five automatic layouts
- Draggable connectors with line jumps
- Twelve emphasis colours, each of which can be named
- Named colours appear in the legend and exports
- Draggable legend, position saved with the diagram
- Notes on tables and on connectors
- Table notes open on the canvas
- Diagram description shown on the canvas
- Grid toggle
Drawing
- Sticky notes, resizable and rotatable
- Text boxes with no background or border
- Arrows in any colour
- Annotations drawn in front of or behind the model
- Annotations attached to a table or connector with a leader
Design
- Propose a new table
- Propose a column on an existing table
- Propose a relationship between any two tables
- Represent an external system
- Mark tables, columns and relationships deprecated
- A proposed 1:N writes its own lookup column
- Status shown by border, badge and colour together
Saving and refreshing
- Save and reopen
.dvmdfiles - Older file formats upgraded on open
- Refresh an existing diagram with the latest changes
- Confirmation required before anything proposed is promoted
- Saved view restored when a diagram is reopened
Export
- PNG and SVG
- draw.io, keeping arrows as editable edges
- Mermaid
- Visio (experimental)
- Markdown wiki documentation
- Self-contained HTML documentation
- Every format states its limits before you save
General
- Light and dark themes, remembered between sessions
- Command bar collapses into an overflow menu
- Long-running jobs can be cancelled
- Built-in "What this tool can do" guide
- Reads metadata only, never writes to the environment
Installation
Installation: around 2 minutesRequirements: XrmToolBoxDownload: 1 ZIP file, containing one DLL
Requirements
- Windows
- XrmToolBox 1.2025.10.74 or later
- .NET Framework 4.8
- Microsoft Edge WebView2 Runtime - ships with Windows 11 and with XrmToolBox itself. If the tool reports a missing runtime, install the Evergreen WebView2 Runtime and restart XrmToolBox.
- A Dataverse connection in XrmToolBox with permission to read metadata
The tool is not available in the XrmToolBox Tool Library. Install it manually using the steps below.
Install
- Download the ZIP
- Extract the ZIP. It contains
Oliver4.DataModelDesigner.dlland the licence file. - Close XrmToolBox. It locks plugin assemblies while it is running, so the copy will fail otherwise.
- Copy
Oliver4.DataModelDesigner.dllinto your XrmToolBox plugins folder:%APPDATA%\MscrmTools\XrmToolBox\Plugins - Unblock the file. Windows tags files that arrive by download, email or an untrusted ZIP, and XrmToolBox skips a blocked assembly silently - there is no error, the tool simply does not appear in the list. In PowerShell:
Unblock-File "$env:APPDATA\MscrmTools\XrmToolBox\Plugins\Oliver4.DataModelDesigner.dll"You can also right-click the DLL, choose Properties, and tick Unblock.
- Start XrmToolBox.
Confirm it installed
Look for Oliver4 Data Model Designer in the XrmToolBox tool list.
If it is not there, the most likely cause is step 5 - the file is still blocked, or it was copied while XrmToolBox was running.
Updating
Repeat the same steps and overwrite the existing DLL. Close XrmToolBox first, and unblock the new file.
Usage
- Open Oliver4 Data Model Designer from the XrmToolBox tool list and connect to an environment.
- Choose a starting point. The tool asks one question at a time: start from a solution, from tables you select yourself, from a blank canvas, or open a saved
.dvmdfile. - Select the tables you want, then confirm which relationships to include. The tool discovers relationships between the tables you are adding and any already on the canvas.
- Work on the diagram. Drag cards, change the level of column detail, apply a layout, and select a table or a connector to inspect it.
- Use Explore relationships to work outwards from a table, or Propose new tables to add proposed tables, columns, relationships and external systems.
- Save the diagram as a
.dvmdfile so you can reopen it at a later point and refresh it against Dataverse if required. - Export a diagram or the documentation when you need to share it.
Worth knowing
- The tool reads metadata only. It never writes to the connected environment.
- Refresh reviews differences and asks before promoting anything proposed to an existing diagram.
- Visio export is experimental, and each export format tells you what it cannot carry before you choose a filename.
- Image exports always use the light theme, whichever theme is on screen.
Open source
Oliver4 Data Model Designer is free and open source. The source code and project information are available in the project's GitHub repository.
- Licence
- MIT
- Version
- 1.11.5
- Cost
- Free
- Source
- GitHub
Free and open source · MIT
Source code and project information live in the tool's GitHub repository.
Have an idea?
Have an idea for a feature, an improvement or a future Oliver4 tool? We would be interested in hearing it.
Suggest a feature